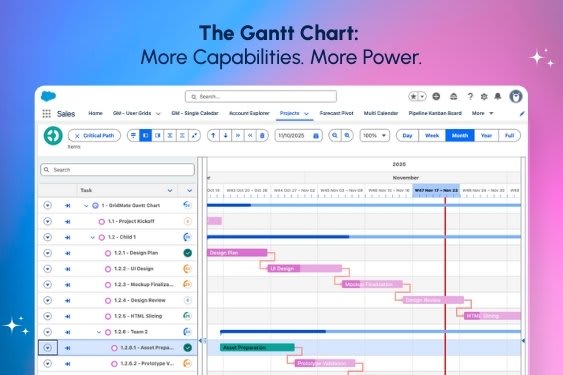
The GridMate Gantt Chart - now with extra muscle
Our Gantt Chart just got a wave of upgrades designed for real-world project chaos: shifting timelines, resource juggling, and the need to try things without breaking everything. Here’s what’s new, and why it matters:
☑️ Baselines: capture a snapshot of your project at any moment and compare planned vs. actual progress over time. Perfect for weekly check-ins and those “how did we get here?” moments.
☑️ Edit more, directly in the chart: update fields, dates, and even assign resources without leaving the Gantt view. Fewer clicks, faster planning.
☑️ True dependency control: start-to-start, finish-to-start, finish-to-finish (and more) with instant visual updates when things shift.
☑️ Save with confidence: preview changes, review history, and revert before hitting save. Experiment freely, commit intentionally.
☑️ Smarter visuals: tasks now color themselves based on stage, making progress (and problems) obvious at a glance.
☑️ Faster project kickoff: hit “New” and your hierarchy, shadow elements, and sync are ready to go. No more setup friction.
Bottom line? Planning feels lighter, changes feel safer, and your Gantt finally keeps up with how projects actually work.
Ready to take it for a spin?